监控你的 JHipster 应用
JHipster provides several options to monitor your applications at runtime.
简述
自动创建的仪表盘
针对传统类应用和网关,JHipster 会自动生成几个仪表盘来监控这些应用。这些仪表盘会在运行时工作,并提供一些简单的监控以最简单的方式。

度量仪表盘
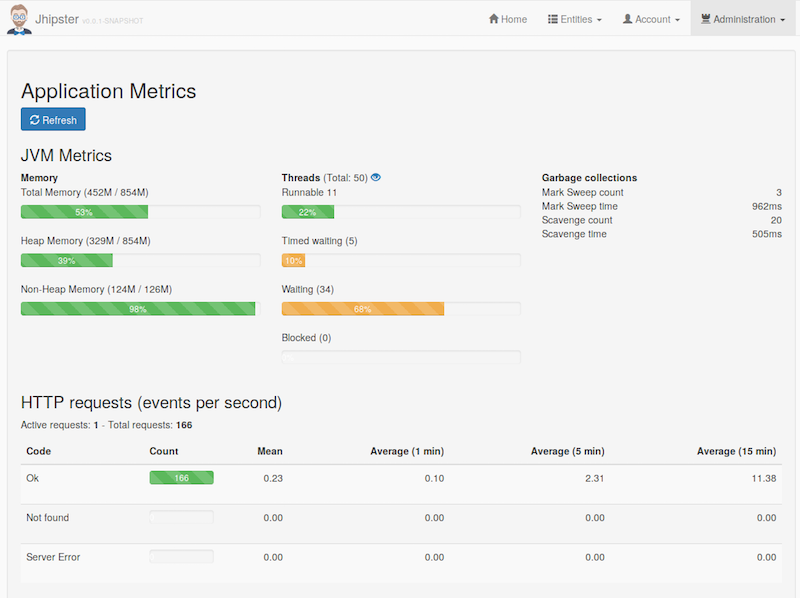
度量仪表盘使用 Dropwizard 度量工具来展示应用性能。
它可以监控这些:
- JVM
- HTTP 请求
- 在 Spring Beans 中使用的方法(使用
@Timed注解) - 数据连接池
点击 JVM 线程度量旁边的眼睛按钮,你将能获取到应用的 stacktrace,对找线程阻塞(blocked threads)非常有帮助。
health 仪表盘
The health dashboard uses Spring Boot Actuator’s health endpoint to give health information on various parts of the application. Many health checks are provided out-of-the-box by Spring Boot Actuator, and it’s also very easy to add application-specific health checks.
日志仪表盘
日志仪表盘可以将 Logback 配置的应用日志合并显示。点击旁边的按钮可以改变 Java 包上日志的记录等级。这在开发和生产环境中都非常方便有用。
JHipster Registry
The JHipster Registry has its own documentation page here.
It mostly provides the same monitoring dashboards as in the previous section, but it works on a separate server. As such, it is a bit more complex to set up, but it is highly recommended to have dashboards running outside of the running application: otherwise, they won’t be available when there is an application failure.
JHipster Console
该仪表盘The dashboards described in the previous sections only show the current value of application metrics, when advanced users want to monitor the evolution of those values over time.
Therefore JHipster applications can be configured to forward their metrics to an external monitoring system where they can be graphed over time and analyzed.
To achieve this, JHipster provide the JHipster Console, a custom monitoring solution based on the ELK stack and fully integrated with JHipster.
将日志转发到 JHipster Console
要配置 JHipster 应用转发日志到 JHipster Console,需要在 application-dev.yml 或 application-prod.yml 中打开 logstash 的 logging 参数:
jhipster:
    logging:
        logstash:
            enabled: true
            host: localhost # 如果使用 Mac 虚拟机或者 Windows 的 docker-machine,在这里配置 Docker 主机 IP
            port: 5000
            queueSize: 512
要配置度量监控,打开度量的日志报告功能:
jhipster:
    metrics:
        logs:
            enabled: true
    	    reportFrequency: 60 # 秒
设置这些属性就能将你的日志转发到 Dropwizard 度量工具。
JHipster Console 概况
JHipster Console is a monitoring tool based on the ELK Stack. It provides ready-to-use dashboards and analytics tools to have a real-time overview of your infrastructure’s performance.
It is an Open Source application, available on GitHub at jhipster/jhipster-console.
The ELK stack is composed of:
- Elasticsearch for indexing the data (logs and metrics)
- Logstash to manage and process the logs received from the applications
- Kibana to visualize the logs with a nice interface
The JHipster Console is a Docker-based project that adds features on top of the official Elasticsearch, Logstash and Kibana Docker images. We have made a few visual changes to Kibana and set up useful dashboards, so that you can get started to monitor your JHipster applications in minutes instead of the hours that would be needed to set up your own monitoring infrastructure.

Monitoring a JHipster microservice architecture
The JHipster Console fully supports the monitoring of a JHipster microservice architecture and even provides the following microservice specific features :
- Distributed tracing with Zipkin
- Log enriching with service name, instance ID, Zipkin correlation IDs
- Zipkin server and UI to visualize traces and spans
- Linking between the Zipkin UI and Kibana so that you can jump to the logs corresponding to a particular trace ID (to use this, click on the Logs icon in the trace page)
安装 JHipster Console
If you already have a JHipster microservice architecture set up with the Docker Compose workflow, the JHipster Console can be automatically set up by the Docker Compose sub-generator.
如果你使用的是传统应用,可以使用 JHipster Console 的 Docker-Compose 定义 GitHub 或者用下面的命令启动:
curl -O https://raw.githubusercontent.com/jhipster/jhipster-console/master/bootstrap/docker-compose.yml
然后启动之:
docker-compose up -d
这会一次性启动 Elasticsearch, Logstash, Kibana 以及 ElastAlert。 通过 http://localhost:5601 访问 JHipster Console。如果一切配置正确,它就能开始从应用接受日志并转发日志和度量结果到 Logstash 了。
停止 Console:
docker-compose stop
停止后,如果你不再需要了的话可以删除容器:
docker-compose rm
可以把两条命令合并了使用:docker-compose down.
使用 JHipster Console
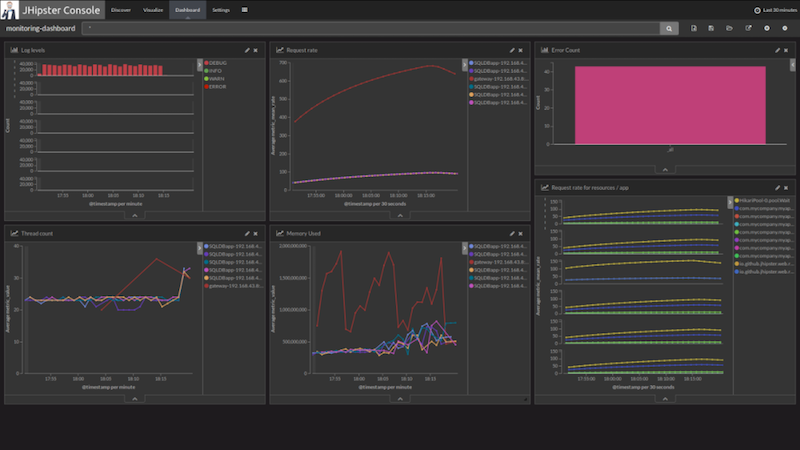
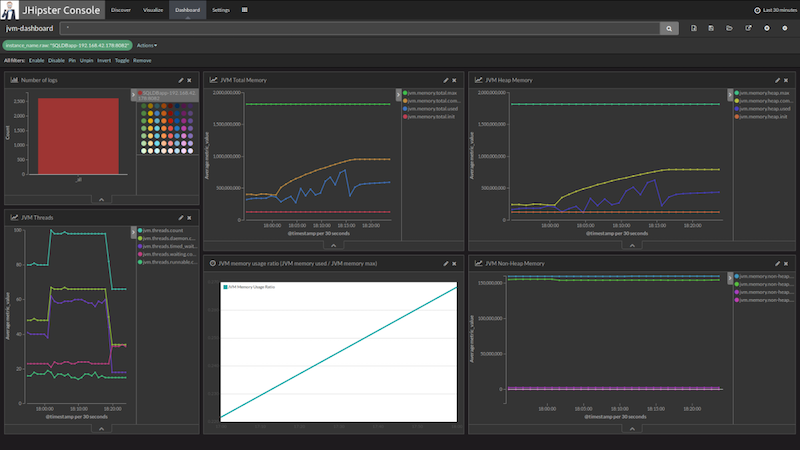
Once your application is running with logs and metrics forwarding enabled, you can view a dashboards by clicking on the Load Saved Dashboards icon ( ) in the Dashboard tab.
You can also use Kibana’s Discover and Visualize tabs to explore your data and create new visualizations. To understand how to use Kibana’s interface effectively please refer to its official documentation in particular the Discover, Visualize and Dashboard sections of the Kibana User Guide.

Data persistence with docker volumes
When using JHipster Console you can enable docker volumes in the docker-compose.yml file by uncommenting the appropriate lines. Those volumes are used to share data between containers and the host. They will persist data and configuration even if containers are removed from your system.
- Elasticsearch has its data saved to
log-data/ - Logstash loads its configuration from
log-conf/logstash.conf, you can edit this file to add new parsing rules for data received by logstash on UDP port 5000. - Kibana loads dashboards description files in
dashboards/on each startup.
Save your custom searches, visualizations and dashboards as JSON for auto import
Searches, visualization and dashboards created in Kibana can be exported using the Management > Saved Objects menu.
You can then extract the JSON description of a specific object under the _source field of the export.json file.
You can then put this data in a JSON file in one of the jhipster-console/dashboards sub-folder for auto-import.
If you have created useful dashboards and visualizations for your JHipster applications please consider contributing those back to the community by submitting a Pull Request on the JHipster Console’s GitHub project.
Forwarding metrics to a supported third party monitoring system (JMX, Prometheus)
JHipster also provides a Metrics exporters for JMX.
Forwarding metrics to alternative systems is also supported and can also simply be enabled in your YAML configuration files.
jhipster:
    metrics:
        jmx:
            enabled: true
Note: Unlike in previous JHipster versions, JHipster 5 metrics reporting only support JMX out of the box. Please have a look to the Metrics official documentation for instructions on how to setup other reporter like Graphite.
JHipster also supports Prometheus as a Metrics exporter. Prometheus is disabled by default and can be enabled in your YAML configuration file.
jhipster:
    metrics:
        prometheus:
            enabled: true
This will export your metrics under /prometheusMetrics. As this endpoint is not secured, you can protect it with basic auth, such that
prometheus can still scrape the endpoint by creating a new configuration file (e.g. BasicAuthConfiguration.java).
@Configuration
@Order(1)
@ConditionalOnProperty(prefix = "jhipster", name = "metrics.prometheus.enabled")
public class BasicAuthConfiguration extends WebSecurityConfigurerAdapter {

    @Override
    protected void configure(HttpSecurity http) throws Exception {
        http
            .antMatcher("/prometheusMetrics/**")
            .authorizeRequests()
            .anyRequest().hasAuthority(AuthoritiesConstants.ADMIN)
            .and()
            .httpBasic().realmName("jhipster")
            .and()
            .sessionManagement()
            .sessionCreationPolicy(SessionCreationPolicy.STATELESS)
            .and().csrf().disable();
    }
}
You can login with the default admin/admin. You must add following configuration to you prometheus configuration such that prometheus can still scrape your application.
basic_auth:
    [ username: "admin" ]
    [ password: "admin" ]
Zipkin
JHipster applications can integrate with Zipkin through Spring Cloud Sleuth to provide distributed tracing for your microservice architecture. To enable Zipkin tracing, package your application with the zipkin maven/gradle profile and set the spring.zipkin.enabled property to true. This will trigger span reporting to the Zipkin server and also add correlation IDs (TraceId, SpanId and ParentId) to request headers and logs. The Zipkin server and UI is provided as part of the JHipster Console and integrates with the Kibana dashboard.
Zipkin also provide a service dependency graph feature that lets you visualize the dependencies between microservices over time.
The Zipkin instance should be available on http://127.0.0.1:9411/ if you run it on your machine, or on http://<docker-host-ip>:9411 if you run it with Docker.
Alerting with Elastalert
JHipster Console comes with built-in alerting by integrating Elastalert, an alerting system that can generate alerts from data in Elasticsearch. Elastalert is simple to use and able to define complex alerting rules to detect failures, spikes or any pattern based on an Elasticsearch Query.
Enable alerting
To enable alerting, setup the jhipster-alerter container by adding the following lines docker-compose.yml.
jhipster-alerter:
    image: jhipster/jhipster-alerter
    #volumes:
    #    - ../jhipster-alerter/rules/:/opt/elastalert/rules/
    #    - ../alerts/config.yaml:/opt/elastalert/config.yaml
Configure alerting
Elastalert configuration can be modified in alerts/config.yaml. For example, you can configure the alerting frequency and the buffer period, by changing the following properties:
run_every:
    minutes: 1
buffer_time:
    minutes: 5
Then you will need to write some rules that define when alerts will be thrown.
Write alertings rules
To define new alerts, add new Yaml rule files in alerts/rules and then test them over past data with:
./test-alerting-rule.sh rule.yaml
Note that those Yaml files should have a .yaml file extension. Read more on how to write rules at Elastalert’s official documentation.